

Which provider’s virtual machines offer the best performance? In this article, we’ll take a look at the results we obtained when comparing Microsoft Azure, Amazon Web Services (AWS) and Jotelulu.
At Jotelulu, we’re committed to offering the best service and we question everything in the pursuit of innovation and continuous improvement. This means that we’re constantly checking out the features and performance offered by other cloud service providers. So, today, we want to share the results of a performance analysis of our own services and those of some of our competitors.
In particular, we carried out performance tests on Microsoft Windows Server virtual machines hosted on the cloud.
- The cloud service providers chosen for this first performance comparison were:
- Microsoft Azure
- Amazon Web Services (AWS)
- Jotelulu (obviously)
- The machines that we tested all had the specifications to make sure the comparison was fair:
- Windows Server 2019 Standard
- 4 cores
- 16 GB of RAM
- SSD disks
- For this performance comparison, we made use of the following tools:
- AS SSD Benchmark to test disk read/write speeds (#1). You can download this program from the following link: AS SSD Benchmark.
- CineBench to test the CPU and main memory performance (#2). You can download this tool from the following link: CineBench.
- Test LAN to test data transfer speeds across networks (#3). You can download this tool from the following link: Test LAN.
NOTE: In case you’d like to learn more about each of these tools, we’ve included some more information about each one in the appendix at the end of this article (after the Conclusion).
Performance Comparison of AWS, Azure and Jotelulu
Now that we’ve explained the tests we carried out, let’s see what the results were!
#1. Disk Speed
For this test, we used AS SSD Benchmark, a program that measures the read and write performance of the disk in both sequential and random mode.
We performed this test using different file sizes:
- 1 GB (default size)
- 3 GB
- 5 GB
- 10 GB
And for each of these file sizes, we performed the following test:
- Seq-test: measures file read/write times for a 1 GB file.
- 4K: measures the read/write times of random 4K blocks.
- 4K-64Thrd: measures the read/write times of 4K blocks distributed to 64 threads.
- Time: measures the response to data compression.
Based on these measurements, the program then produces separate read and write scores and an overall score.
For the purposes of this analysis, we’re mainly interested in the overall score.
The results did not vary hugely between the different file sizes. So, we’re just going to look at the results for the 5 GB tests.
Disk Speed Tests for 5 GB
When we look at the results, we can see that Jotelulu comes out on top, with an overall score of 339 points compared with Azure (173 points) and AWS (just 15 points).
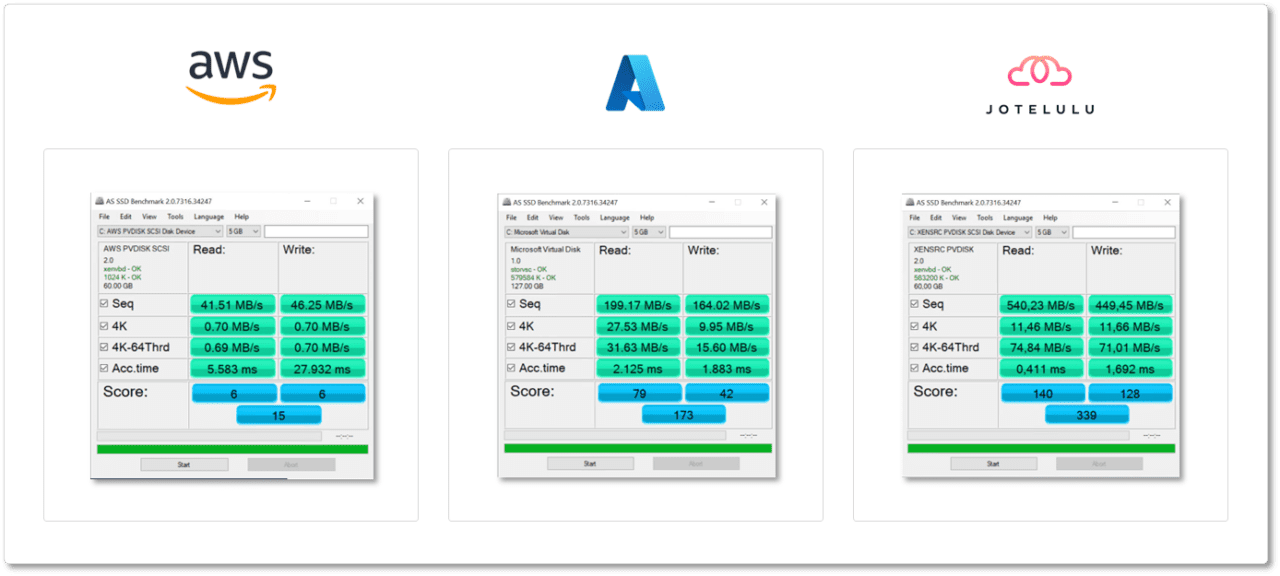
If you look at the image above, you can see that Jotelulu’s access times were five times (x5) faster than Azure and twelve times (x12) faster than AWS, which really performed very poorly in all the disk speed tests.
| 5GB | Test Type | JOTELULU | AWS | AZURE | Units |
| Read | Seq | 540.23 | 41.51 | 199.17 | MB/s |
| 4K | 11.46 | 0.7 | 27.53 | MB/s | |
| 4K-64Thrd | 74.84 | 0.69 | 31.63 | MB/s | |
| Acc.Time | 0.411 | 5.583 | 2.125 | ms | |
| Score | 140 | 6 | 79 | pts | |
| Write | Seq | 449.45 | 46.25 | 164.02 | MB/s |
| 4K | 11.66 | 0.7 | 9.95 | MB/s | |
| 4K-64Thrd | 71.01 | 0.7 | 15.6 | MB/s | |
| Acc.Time | 1.692 | 27.932 | 1.883 | ms | |
| Score | 128 | 6 | 42 | pts | |
| Overall | Score | 339 | 15 | 173 | pts |
Table – Comparison of disk speeds for 5 GB
#2. CPU Performance
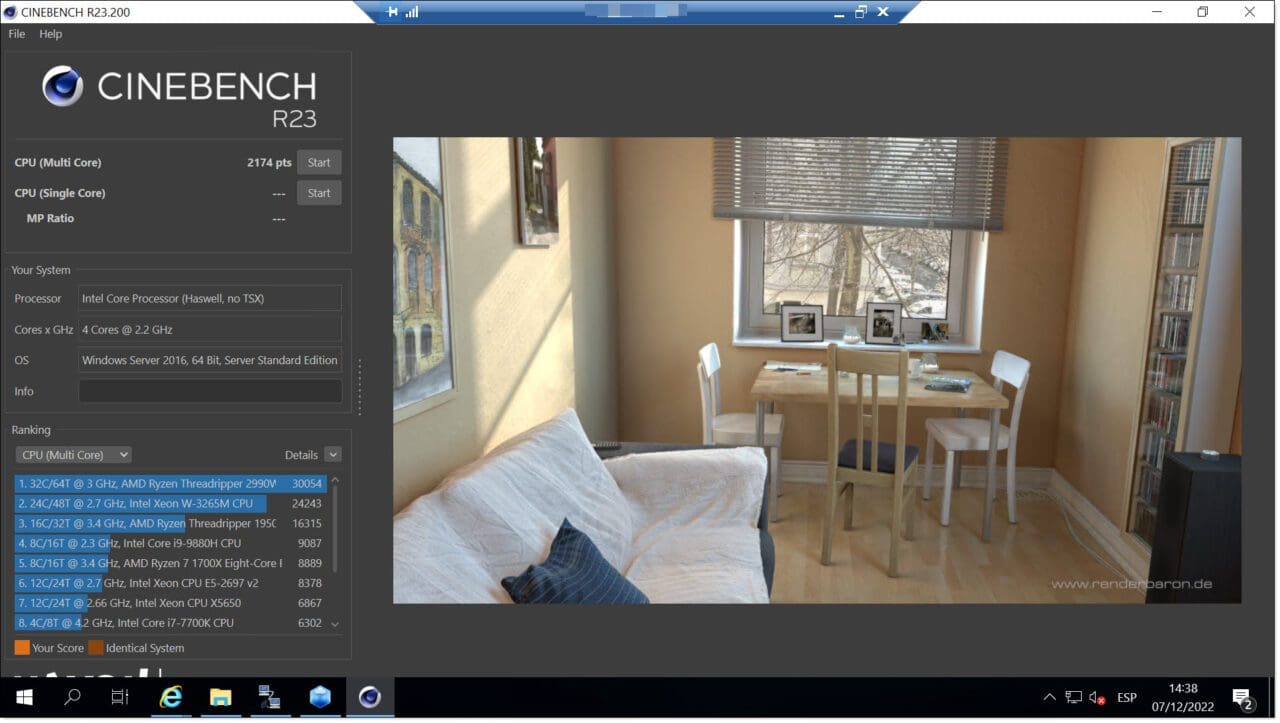
The second test we ran was to check CPU performance. To do this, we used CineBench, which gave us some quite surprising results.
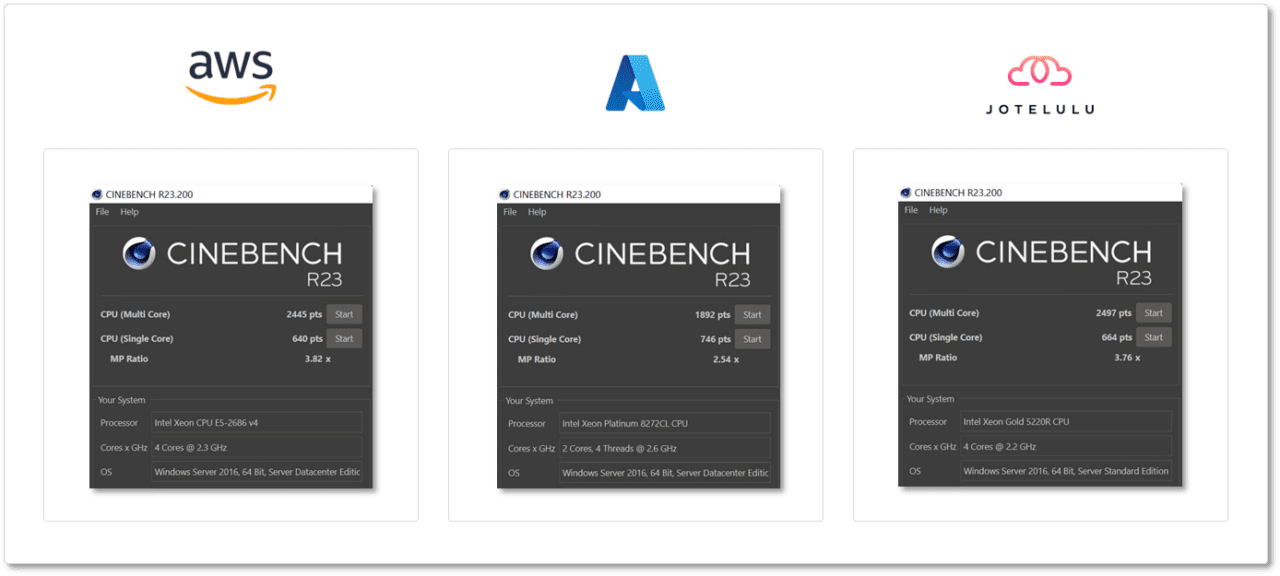
In the Multicore CPU tests, Jotelulu performed the best, with AWS in second and Azure in last place.
| JOTELULU | AWS | AZURE | |
| CPU (Multi Core) | 2,497 pts | 2,445 pts | 1,892 pts |
Table – Comparison of CPU performance (Multi Core)
However, when we performed Single Core tests, the situation radically changed. This time, Azure came out clearly ahead of Jotelulu and AWS in last place.
| JOTELULU | AWS | AZURE | |
| CPU (Single Core) | 664 pts | 640 pts | 746 pts |
Table – Comparison of CPU performance (Single Core)
But when we look at the MP Ratio, which is the relationship between the multi core and single core tests, AWS is only slightly ahead of Jotelulu and Azure finished quite far behind them both.
| JOTELULU | AWS | AZURE | |
| MP Ratio | 3.76 x | 3.82 x | 2.54 x |
Table – MP Ratio comparison
Therefore, we can conclude that AWS performs slightly better than Jotelulu overall, but Jotelulu comes out on top for operations that make use of the entire CPU.
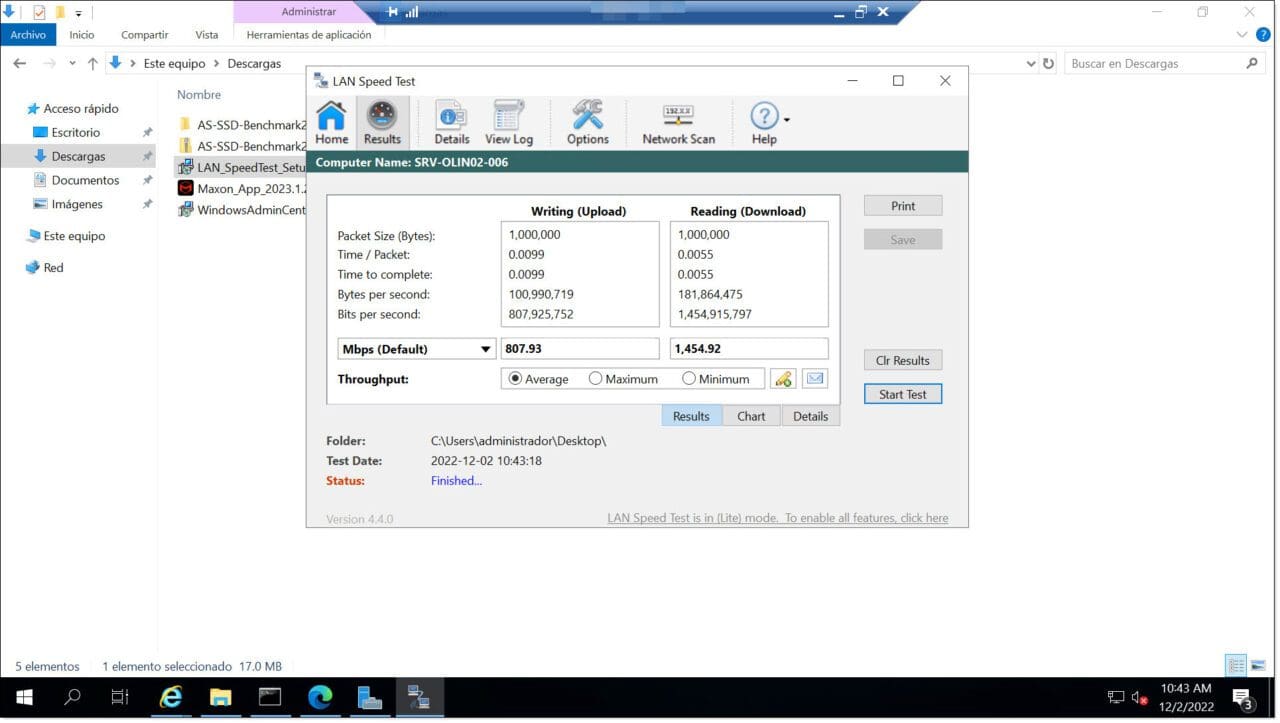
#3. Network Data Transfer
Finally, we measured the network data transfer speeds of each provider. To do this, we used the LAN Speed Test tool, which measures data transfer speed across different media, such as hard drives, USB drives and network cards.
NOTE: This application provides minimum, maximum and average readings. We’ll use the average reading for this benchmarking exercise.
For this test, we decided to transfer data to a remote hard drive (Z Drive) that was located outside the infrastructures of the different companies. This way, we can be sure that would be no unfair bias due to the location of the disk.
In this test, the program writes random data in a 2 GB file and then reads the file, measuring the transfer rates of each process.
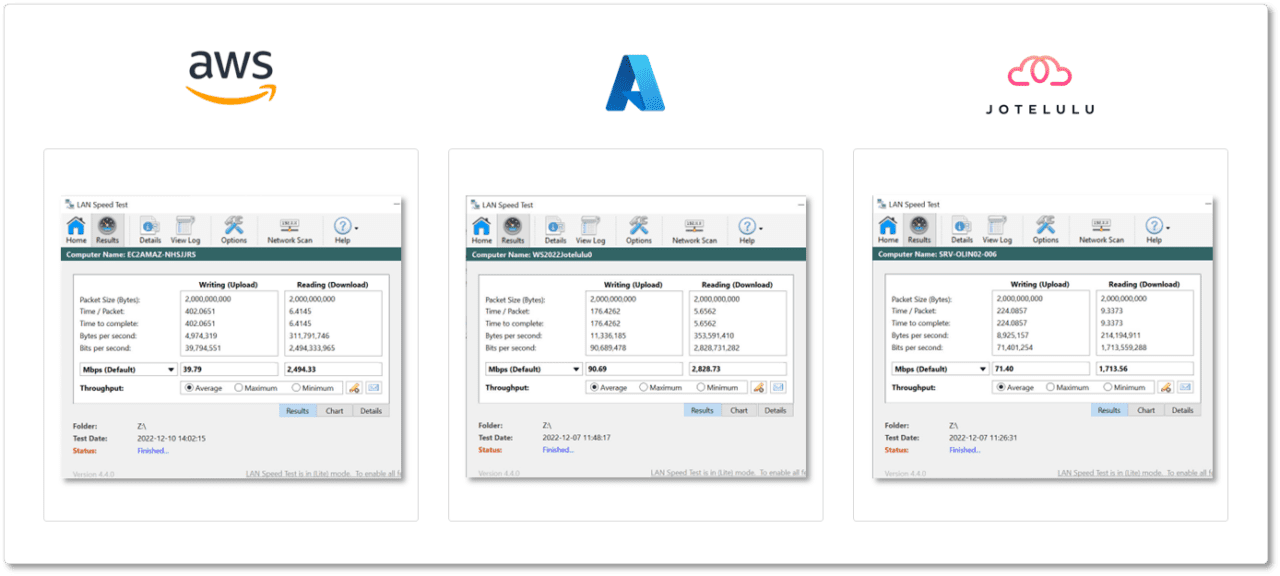
For the writing test, Jotelulu didn’t perform quite so well. Azure came first, with Jotelulu in second and AWS in third.
Then, in the reading test, Azure remained in first place, but AWS moved into second, leaving Jotelulu last. Azure was some 10% faster than AWS, and AWS was some 30% faster than Jotelulu.
| Measurement | JOTELULU | AWS | AZURE | |
| Writing (Upload) | Packet Size (Bytes) | 2,000,000,000 | 2,000,000,000 | 2,000,000,000 |
| Time / Packet | 224.0857 | 402.0651 | 176.4262 | |
| Time to complete | 224.0857 | 402.0651 | 176.4262 | |
| Bytes per second | 8,925,157 | 4,974,319 | 11,336,185 | |
| Bits per second | 71,401,254 | 39,794,551 | 90,689,478 | |
| Mbps (Default) | 71.4 | 39.79 | 90.69 | |
| Reading (Download) | Packet Size (Bytes) | 2,000,000,000 | 2,000,000,000 | 2,000,000,000 |
| Time / Packet | 9.3373 | 6.4145 | 5.6562 | |
| Time to complete | 9.3373 | 6.4145 | 5.6562 | |
| Bytes per second | 214,194,911 | 311,791,746 | 353,591,410 | |
| Bits per second | 1,713,559,288 | 2,494,333,965 | 2,828,731,282 | |
| Mbps (Default) | 1,713.56 | 2,494.33 | 2,828.73 |
Table – Comparison of transfer of 2 GB to a remote drive
Conclusion
In this article, we briefly looked at the results of some performance comparison measurements for virtual machines hosted on Jotelulu, Microsoft Azure and Amazon Web Services (AWS). All these tests were performed on virtual machines with the same specifications to ensure that there was a level field. Furthermore, we performed each test several times and selected the result closest to the average figure to ensure that our results were as accurate as possible.
Having collected all the data, we can see that Jotelulu servers provide good performance overall, and in some cases are the best available choice.
Jotelulu came out way ahead of the rest in the disk speed tests, with AWS performing very poorly. Jotelulu performed the best in the Multi Core CPU tests, but fell behind Azure in the Single Core tests. Lastly, Jotelulu’s performance came in behind Azure for network data transfer speeds.
We hope that this analysis has shed some light on the level of service that we offer and helps you to make the right decision when choosing a cloud service provider.
If you’d like to find out more about the different analysis tools that we used for these tests, feel free to check out the appendix below.
Thanks for reading!
Appendix – Details About The Tools Used
**Here is a short description about each tool that we have used to put together this analysis.
AS SSD Benchmark:
AS SSD Benchmark is able to perform read and write tests on a disk, both in sequential mode and randomly. It also blocks the memory cache to allow you to find out the true IOPS figures.
To measure this data, AS SSD Benchmark writes and then reads a file of a given size (initially, 1 GB) with randomly chosen 4K blocks. It performs its tests using one or 64 threads, measuring performance and the SSD access time as it goes.
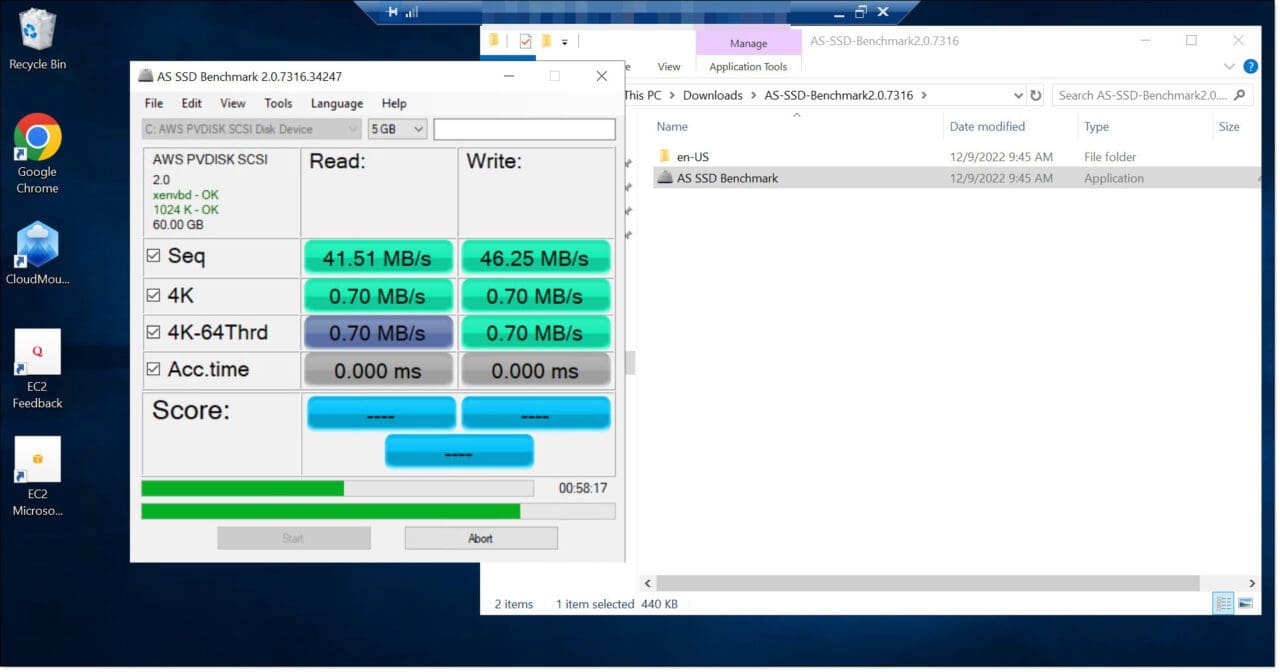
The additional options allow you to measure performance when writing large files, multiple small files or a combination of file sizes. It also evaluates the disk performance in response to data compression.
The program performs the following tests:
- Seq-test: measures file read/write times for a 1 GB file.
- 4K: measures the read/write times of random 4K blocks.
- 4K-64Thrd: measures the read/write times of 4K blocks distributed to 64 threads.
- Time: measures the response to data compression.
We performed this test using different file sizes:
- 1 GB (default size)
- 3 GB
- 5 GB
- 10 GB
Based on these measurements, the program then produces separate read and write scores and an overall score.
The measurements can be made when transferring the following file sizes:
- 1 GB (default size)
- 3 GB
- 5 GB
- 10 GB
NOTE: If you’re thinking of running these tests on a local machine, please bear in mind that the process is quite time consuming.
CineBench:
CineBench is one of the leading programs for assessing the hardware capabilities of all types of machines. It’s often used for benchmarking analyses by magazines and specialist websites, as well as by systems administrators looking to optimise their systems or evaluate new systems before they buy them.
This software performs a series of tests to assess the general capabilities of the CPU by making it perform high-intensity tasks. It essentially gets the machine to produce a single image using the latest rendering techniques. The program then analyses how the CPU is handling the threads and memory.
CineBench can perform tests in both multi core and single core mode, and if you perform both tests, you can obtain an MP Ratio, which is the relationship between the two.
LAN Speed Test
LAN Speed Test is a tool designed to measure data transfer speeds across different media, such as hard drives, USB drives and network cards, whether wired or wireless.
To perform these measurements, you need to specify a destination folder, which can local or remote, although you’ll need to use a remote folder (such as a shared folder) to perform network tests.
Once you have specified a destination folder, the program will create a file which is then uploaded and downloaded. It also blocks the use of the OS cache at the same time to avoid false readings.
Other Performance Comparison Tools
Initially, we did consider other benchmarking tools, such as Sandra. But in the end, we discarded this idea because these programs employed tests that put the machine under stress. This would cause hypervisor systems to disconnect in order avoid issues.