Cloud and Systems
Support for IT companies
At Jotelulu, we question everything and scrutinize every detail. This stems from our obsession with delivering the best service to our customers, driving a strategy of continuous innovation and improvement. With this mindset (or obsession), we constantly benchmark features and optimizations against other cloud providers. This time, we’ve published our findings as an article comparing OVH and Jotelulu, answering the question: Which provider delivers better virtual machine performance—OVH or Jotelulu?
Below are the results from various performance tests conducted on Microsoft Windows Server virtual machines from both OVH and Jotelulu.
NOTE: Detailed tool analysis available at the end of the article after conclusions.
As mentioned, CineBench tested processor performance. Jotelulu showed significant superiority.
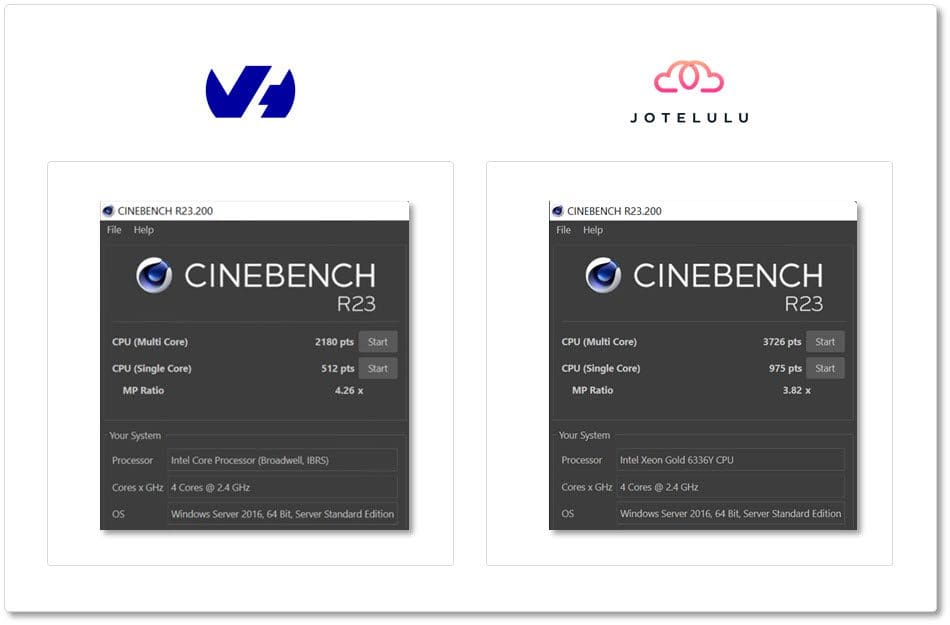
In CPU Multi-Core tests (using all cores), Jotelulu delivered ~70% better performance than OVH:
| | JOTELULU | OVH |
|—————-|————|——–|
| **CPU (Multi Core)** | **3726 pts** | 2180 pts |
Single-Core tests showed Jotelulu nearly doubling OVH performance (90% advantage):
| | JOTELULU | OVH |
|—————-|————|——–|
| **CPU (Single Core)** | **975 pts** | 512 pts |
OVH led slightly in MP Ratio (multi vs single-core scaling):
| | JOTELULU | OVH |
|—————-|———-|———|
| **MP Ratio** | 3.82x | **4.26x** |
Jotelulu excels in CPU-intensive workloads.
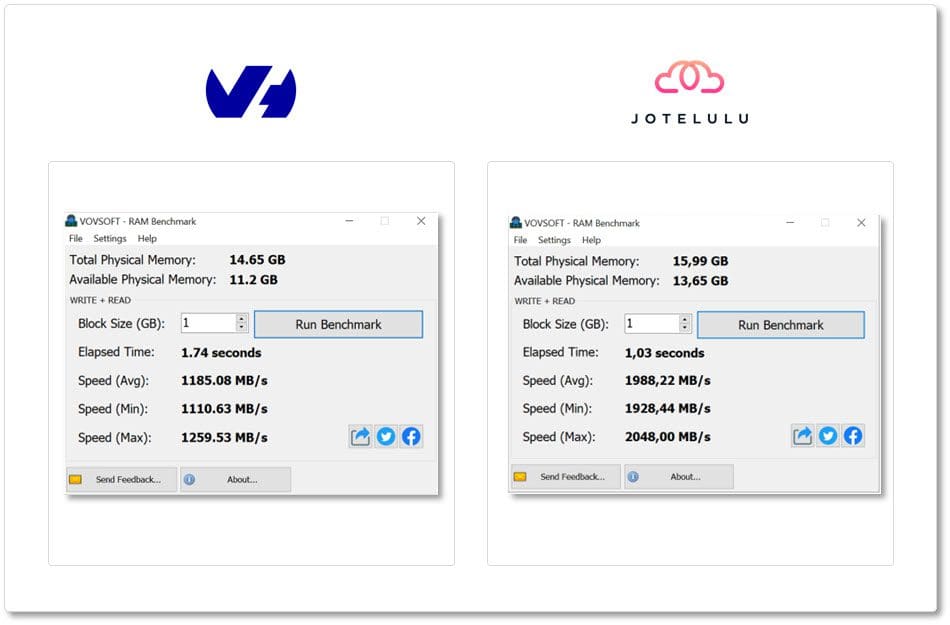
Vovsoft measured RAM performance across four metrics. Jotelulu dominated all categories, showing 68% better performance (e.g., elapsed time).
| Metric | Jotelulu | OVH |
|————————-|——————-|——————|
| **Total Physical Memory** | **15.99GB** | 14.65GB |
| **Available Memory** | **12.26GB** | 11.2GB |
| Block Size | 1GB | 1GB |
| **Elapsed Time** | **1.03s** | 1.74s |
| **Speed (Avg)** | **1988.22 MB/s** | 1185.08 MB/s |
| **Speed (Min)** | **1928.44 MB/s** | 1110.63 MB/s |
| **Speed (Max)** | **2048.00 MB/s** | 1259.53 MB/s |
LAN Speed Test measured network throughput to a remote drive (Z:). Tests wrote/reads 2GB random data files.
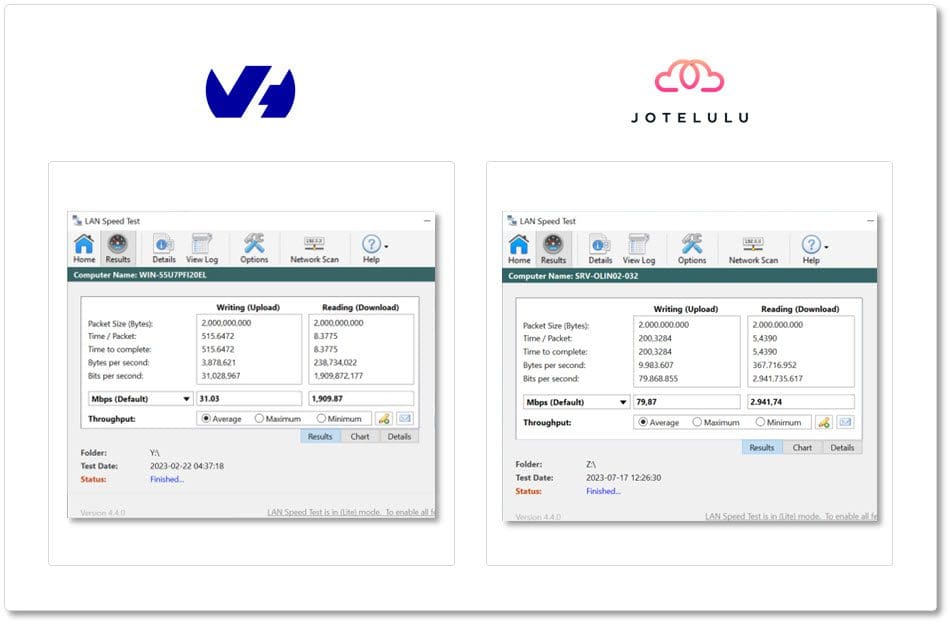
Jotelulu led both read/write: 256% faster writes, 154% faster reads.
| Test | Metric | JOTELULU | OVH |
|—————|——————–|—————|————-|
| **Writing** | Time/Packet (s) | **200.33** | 514.65 |
| | Bytes/sec | **9,983,607**| 3,878,621 |
| | **Mbps** | **79.97** | 31.03 |
| **Reading** | Time/Packet (s) | **5.44** | 8.38 |
| | Bytes/sec | **367M** | 238M |
| | **Mbps** | **2941.74** | 1909.87 |
This analysis used dedicated benchmarking tools to test key VM performance metrics, comparing identical configurations from Jotelulu vs OVH.
Jotelulu consistently outperformed OVH:
– CPU: Superior multi/single-core performance
– RAM: 68% faster transfer speeds
– Network: 154-256% better throughput
We hope this analysis guides your cloud provider evaluation.
Industry-standard CPU benchmark using ray-tracing rendering. Tests single/multi-core performance and MP Ratio.
Simple RAM speed tester supporting DDR1-5. Measures read/write speeds across block sizes.
Network throughput tester for HDD/USB/LAN. Bypasses OS cache for accurate measurements.