In this article, you’ll learn how to generate a memory dump for a Windows process so that you can analyse it and troubleshoot any problems.
Recently, we posted a tutorial looking at How to Configure Memory Dumps on Windows Server 2022, and we thought we’d pick up where we left off and look at some of the ways you can use memory dumps, particularly for identifying issues with your operating system, applications or services.
Today, we’ll look at how to generate memory dumps for individual Windows processes, whether you’re using Windows Server or a desktop version like Windows 10 or 11.
To refresh your memory a little, memory dumps, also known as “core dumps” or just “dumps”, are records that store the contents of the system memory at a given moment in time, normally when a system or service fails. In this tutorial, we’re just looking at processes, so the memory recorded in a dump will only be that part of the memory dedicated to the process in question.
The contents of this memory dump file can then be used by the sysadmin to work out why the process, service or system behaved the way it did. It can even be used to analyse the behaviour of malware and other threats, which is why memory dumps are so widely used in digital forensics.
How to Generate a Memory Dump for a Windows Process
Before you get started…
To successfully complete this tutorial, you will need the following:
- To be registered with an organisation on the Jotelulu platform and to have logged in.
- A Servers subscription on the platform.
Creating a Memory Dump for a Windows Process
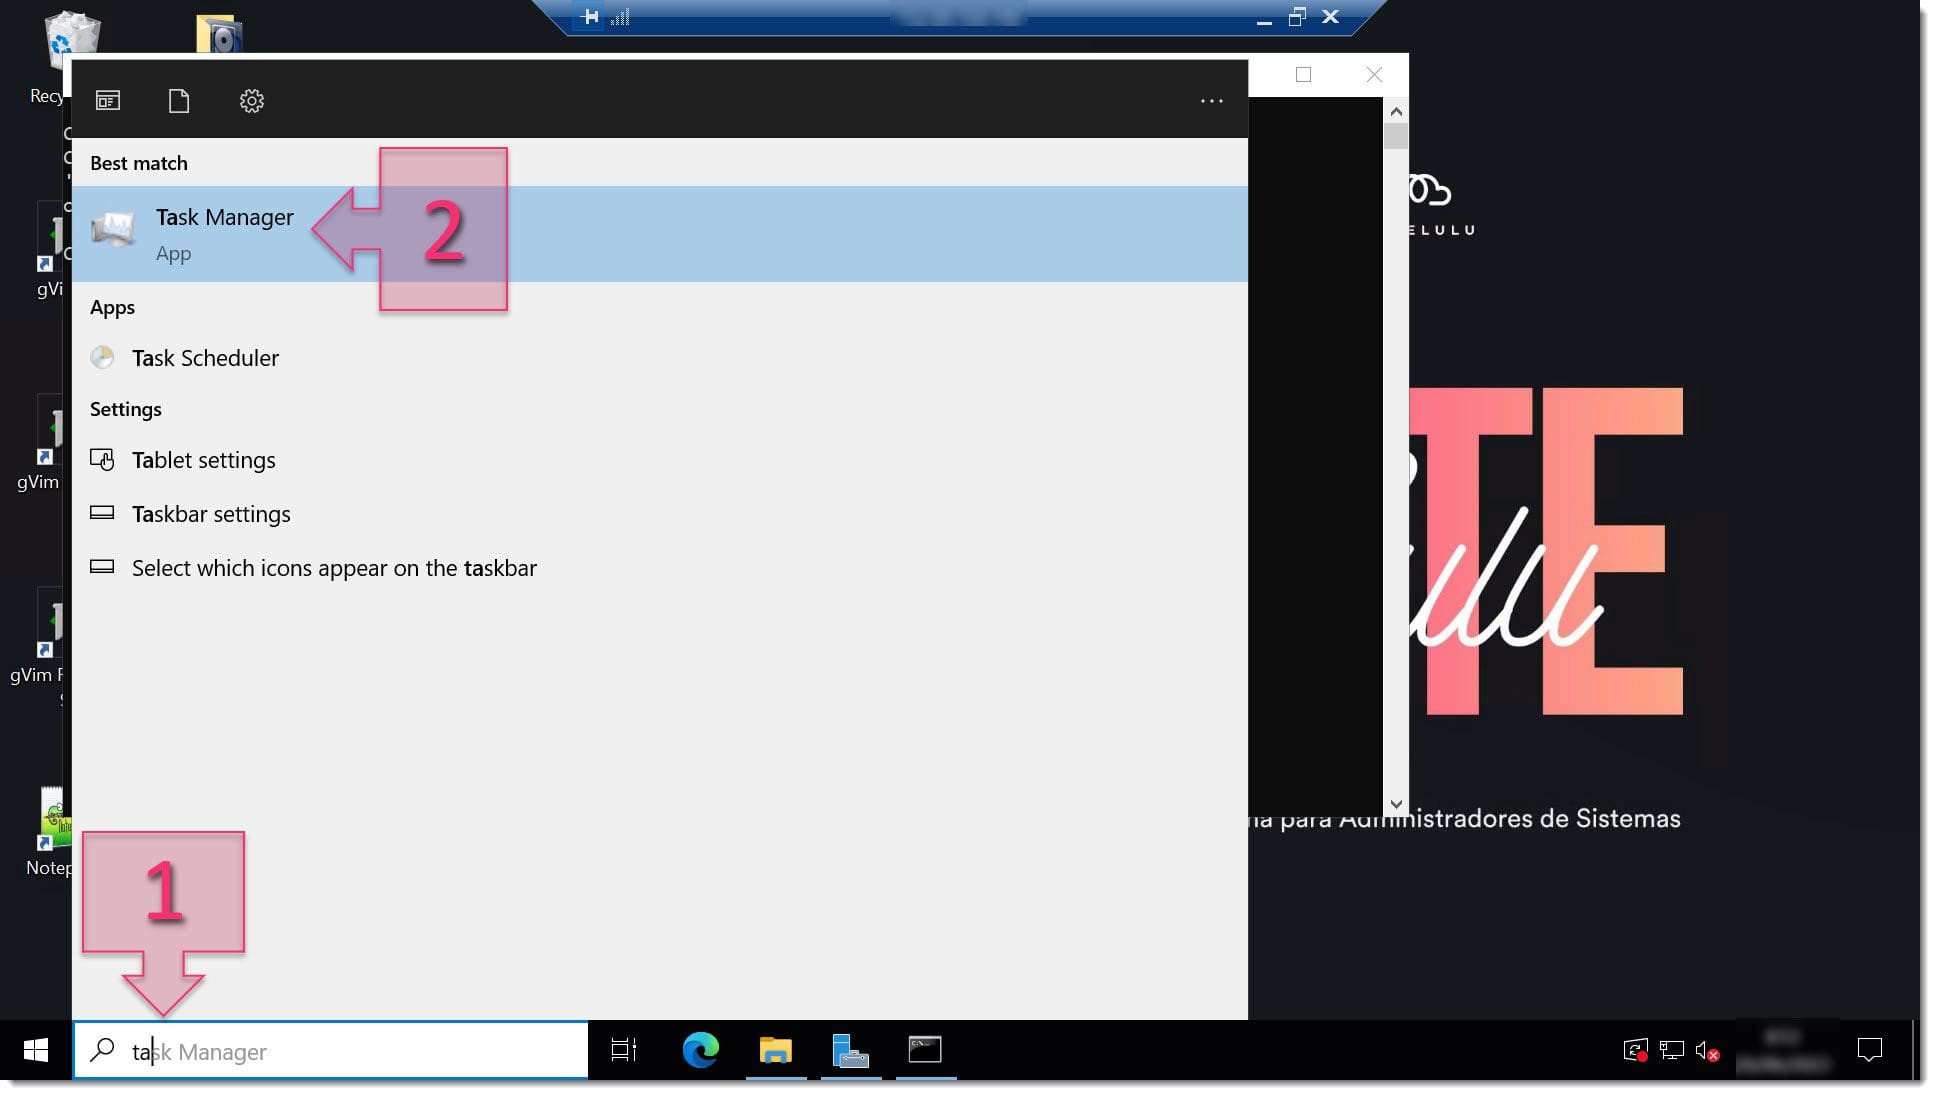
First, you need to open the Task Manager. You can do this by simply typing “Taskmgr.exe” in the search bar (1) and clicking on Task Manager in the results (2). As you can see in the screenshot below, you may not even have the type in the whole thing.

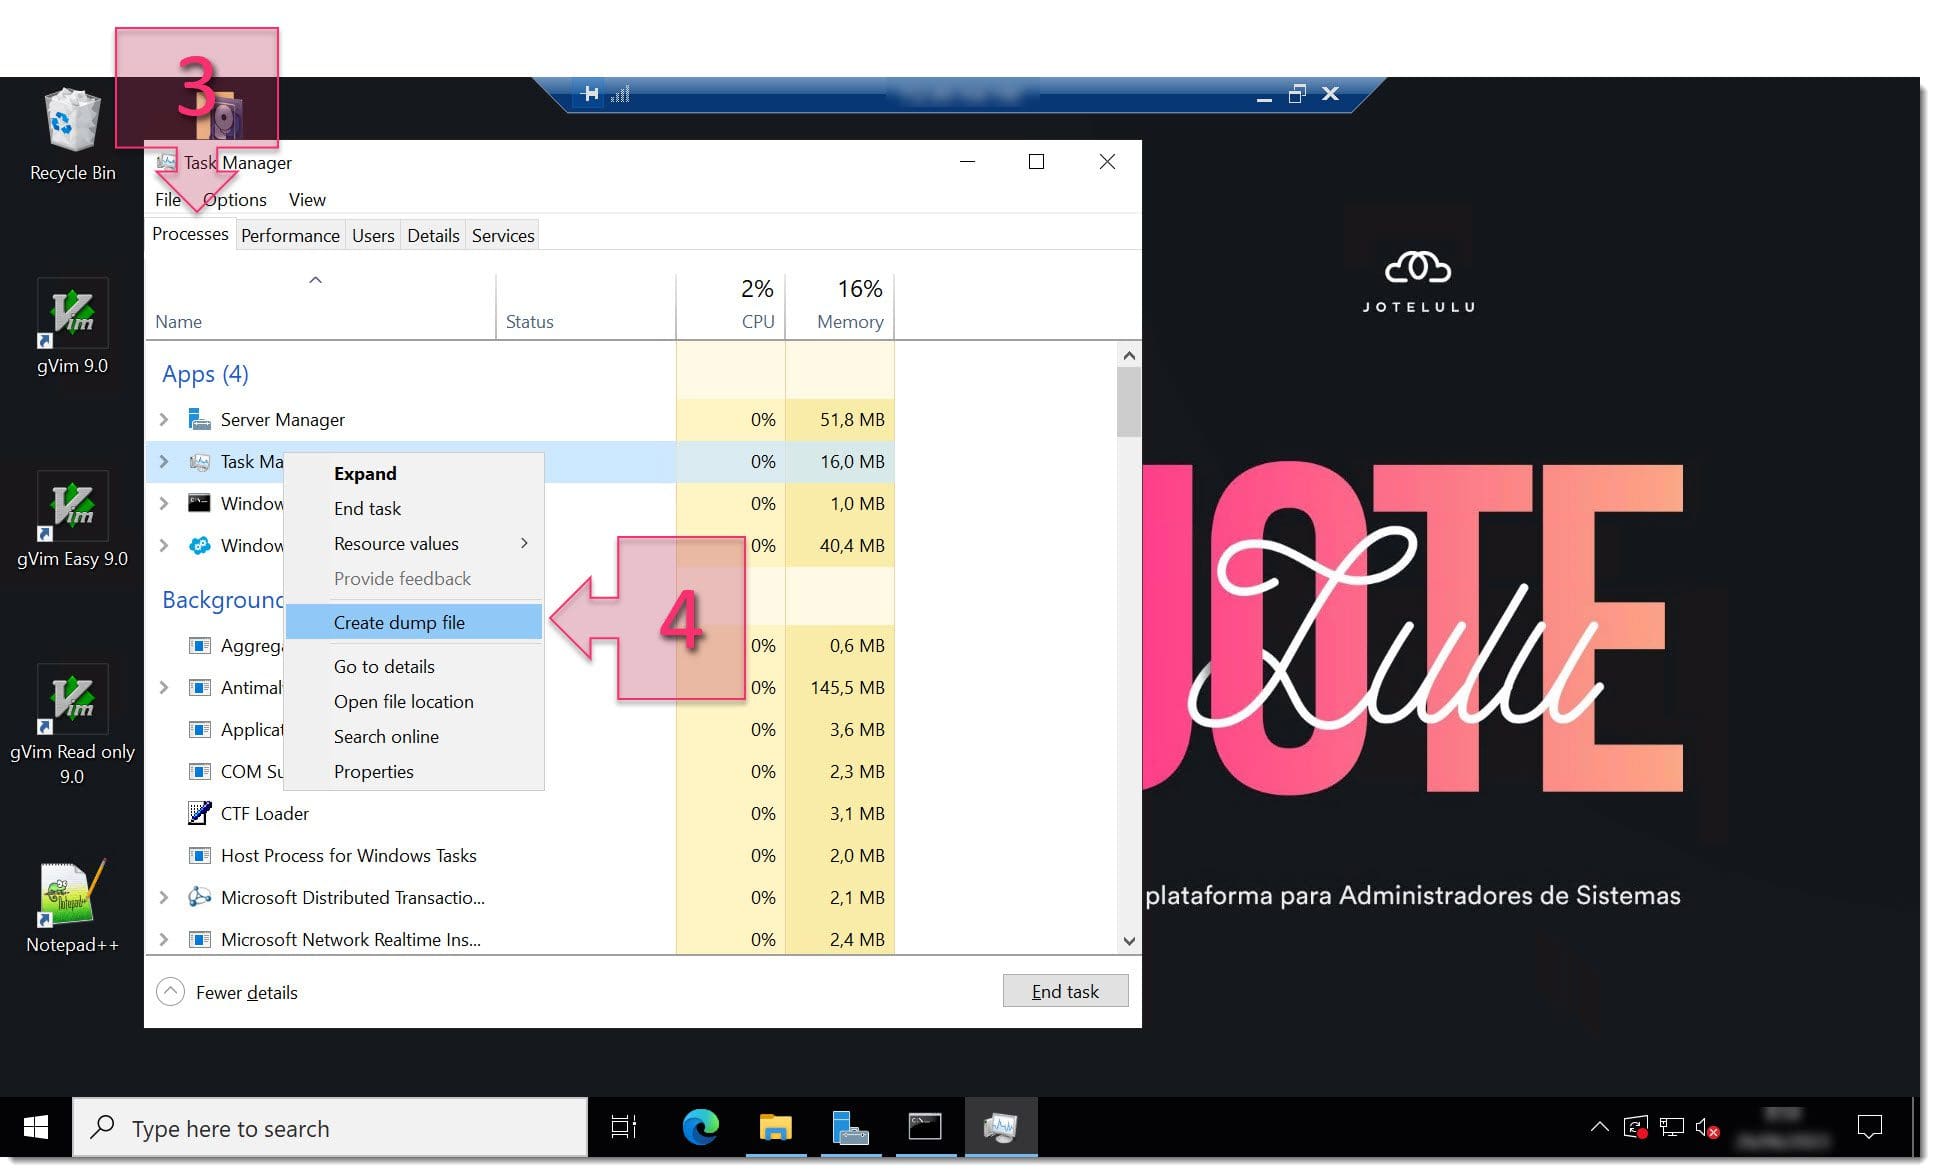
Next, click on the Processes tab (3) and scroll down the list until you find the process that you want to create a dump file for. Once you’ve found it, right-click on the process and click on “Create dump file” (4).

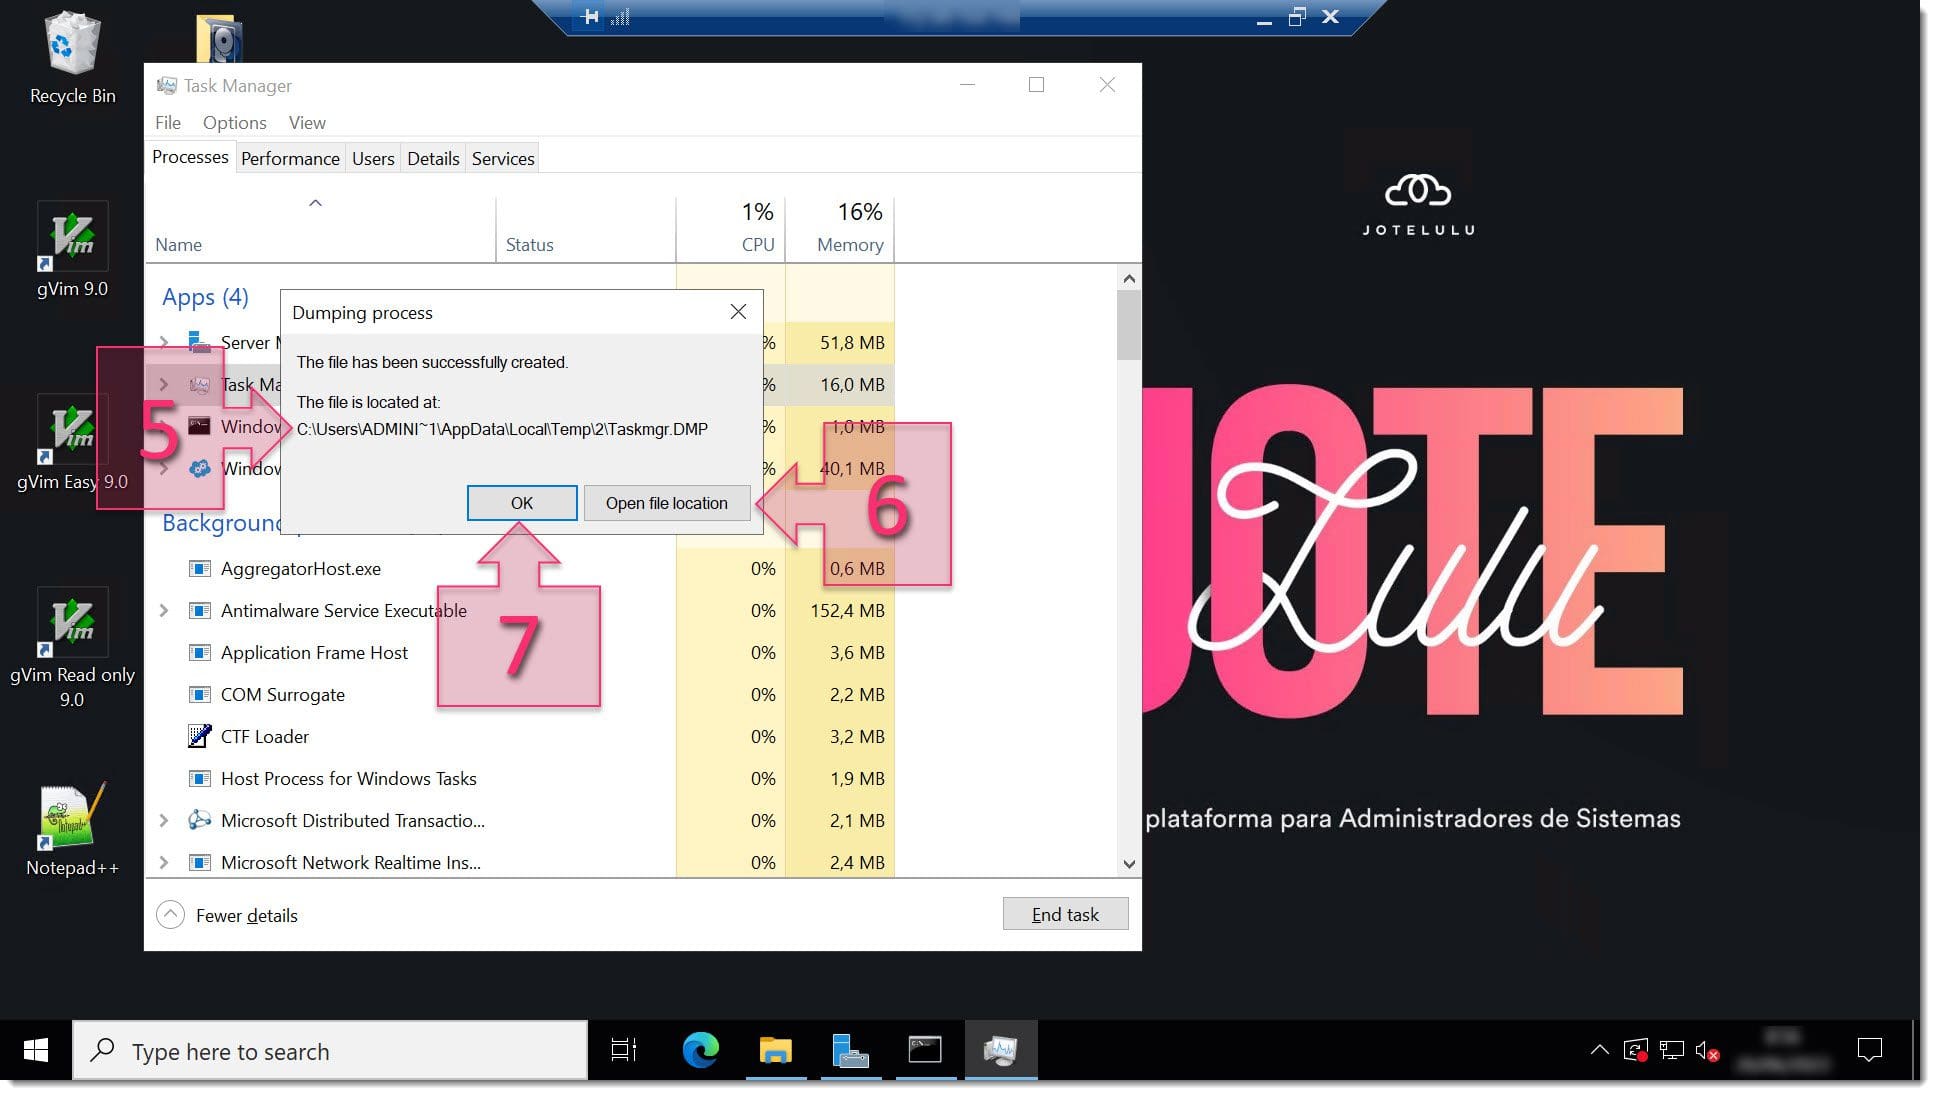
At this moment, a window will appear showing the location of the memory dump file (5), which will consist of a directory and a filename with the extension .dmp. You can either click on Open file location (6) to open the folder or click on OK (7) to close the window.

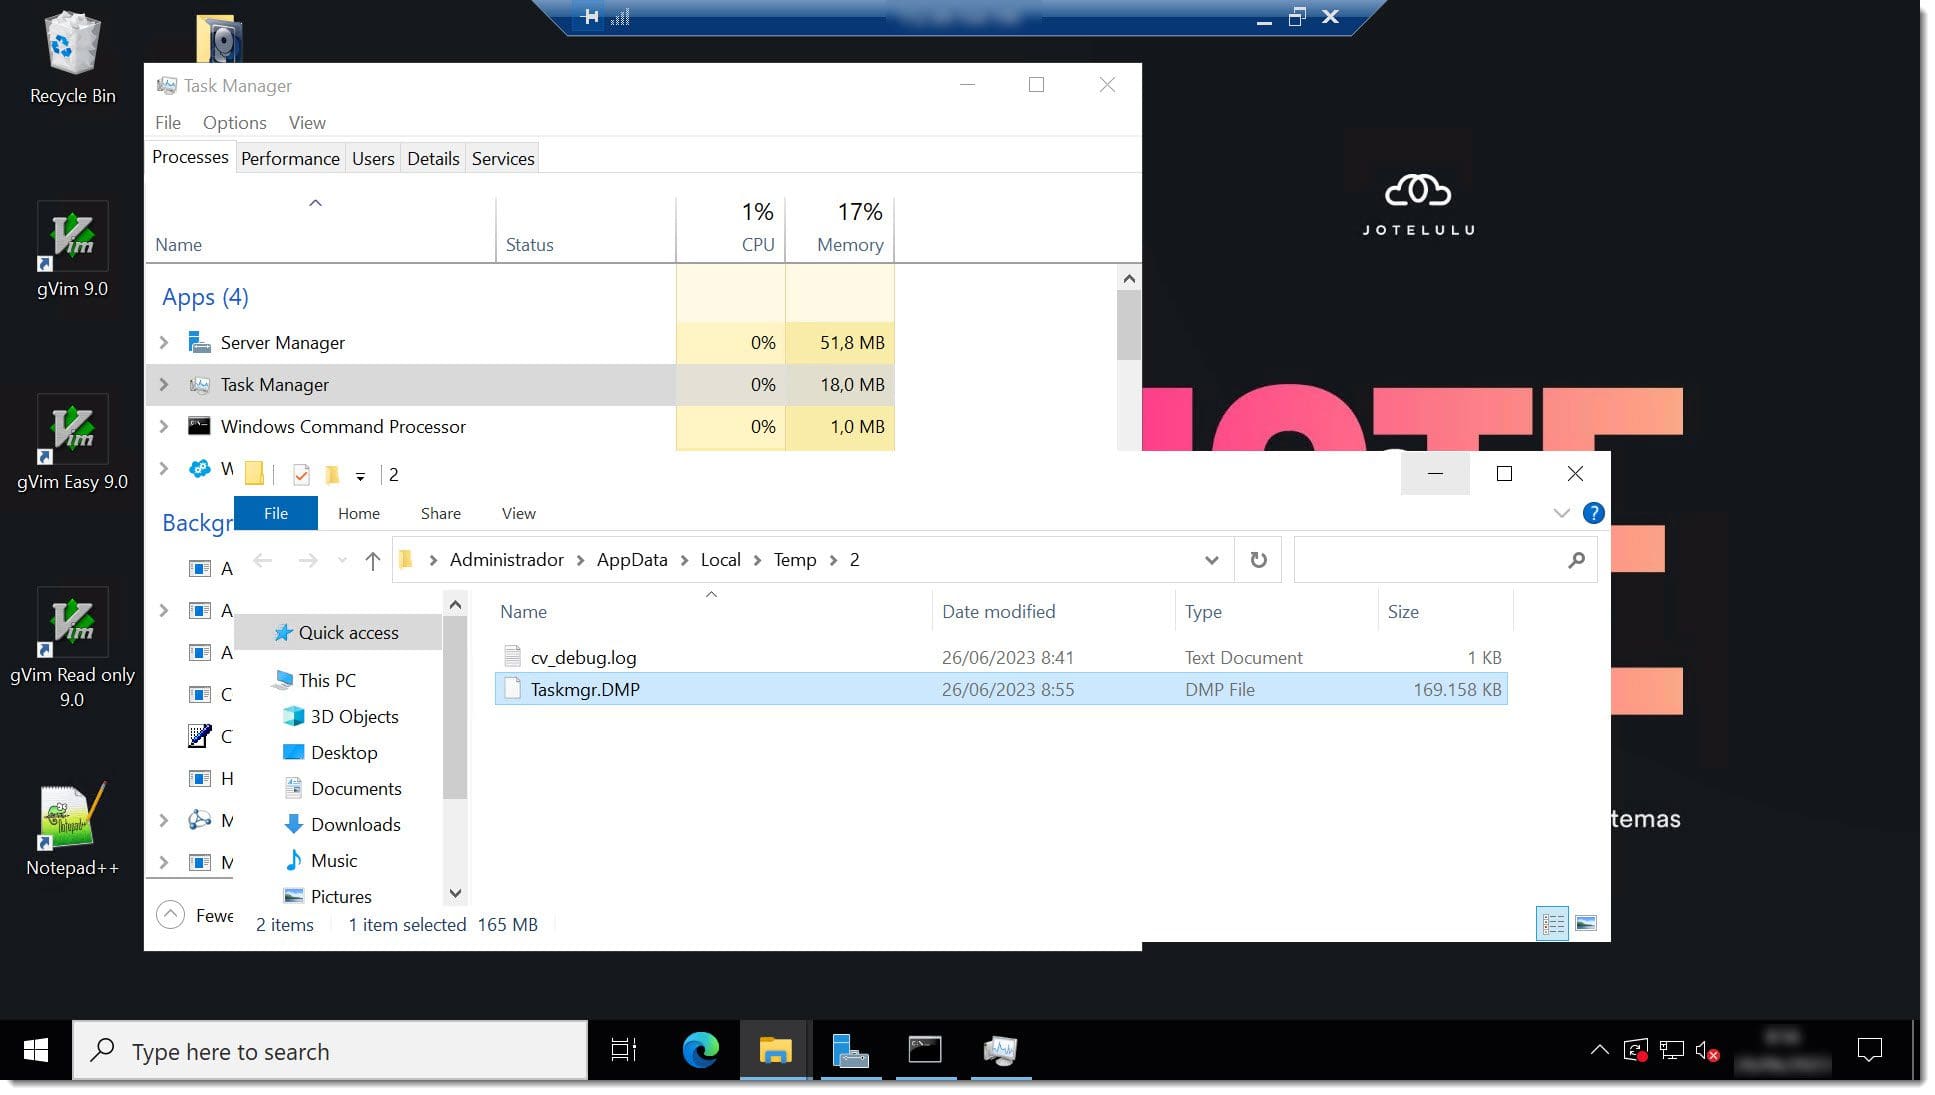
If you open the file location, you may notice two things:
- The dump files are saved in temporary folders.
- They can be quite large files. For this example, the process we have chosen has created a memory dump of 169 MB.

And that’s it! You’ve created a memory dump file for a Windows process that’s now ready for you to analyse.
Summary
In this quick tutorial, you’ve learnt how to generate a memory dump for a Windows process. Now that you know how to do this, if you suspect that there’s a problem with a process or you simply want to run an audit, you can follow these steps to extract valuable information and troubleshoot the application, service or system.
We hope that you’ve found this tutorial useful. We’ll be back with more useful tips about memory dumps soon. In the meantime, if you have any problems or questions about this tutorial, don’t hesitate to get in touch.
Thanks for reading!


